Digital Forensics and Incident Response on Linux

(1) Capture Memory Image
- Find Memory Info
cat /proc/meminfo

- Download LiME
git clone https://github.com/504ensicsLabs/LiME

- Find Linux Version using LiME
cd LiME
cd src
make

- Capture memory and generate its hash
sudo insmod "<LINUX VERSION>generic.ko" "path=/Linux.mem format=lime"
file Linux.mem
md5sum Linux.mem

Note:
padded ~ pads all non-System RAM ranges with 0s
lime ~ each range prepended with fixed-size header containing address space info
raw ~ concatenates all System RAM ranges (warning : original position of dumped memory is likely to be lost)
(2) Analyze Linux Memory via Volatility
- Install Volatility3
sudo git clone https://github.com/volatilityfoundation/volatility3.git

- Recover bash command history from memory
sudo python3 volatility3/vol.py -f Linux.mem linux.bash.Bash
- Lists all memory mapped ELF files for all processes
sudo python3 volatility3/vol.py -f Linux.mem linux.elfs.Elfs
- List process memory ranges that potentially contain injected code
sudo python3 volatility3/vol.py -f Linux.mem linux.pslist.PsList
- List processes in a tree based on their parent process ID
sudo python3 volatility3/vol.py -f Linux.mem linux.pstree.PsTree
- Check if any processes are sharing credential structures
sudo python3 volatility3/vol.py -f Linux.mem linux.check_afinfo.Check_afinfo
- Check system call table for hooks
sudo python3 volatility3/vol.py -f Linux.mem linux.check_syscall.Check_syscall
3) Check Network Connections
- Look at TCP connections including PID-processes
netstat -tnp

- Look at established connections resolving IP addresses including PID-processes
netstat -ap | grep ESTABLISHED

- Look at established connections under IP addresses including PID-processes
netstat -apn | grep ESTABLISHED

- Look at connections in a clear format using lsoflsof -i -P
- Look at connections in a clear format using lsof
lsof -i -P
(4) Capture Network Traffic
- - Check interfaces and dump network trafficnetstat -isudo tcpdump -i eth0 -w kali.pcap
- - Check interfaces and dump network traffic
netstat -i
sudo tcpdump -i eth0 -w kali.pcap
- Persistent network capture until killing tcpdump PID
sudo tcpdump -i eth0 -w kali3.pcap &
sudo ps -aux | grep -i tcpdump
sudo kill <TCPDUMP-PID>
(5) Check Processes
- - Look at running processes sorted by CPU usage including PIDs and full commands
ps -eo pid,%cpu,%mem,command --sort=-%mem | head -n 20

- - Look at real time processes sorted by CPU
top -o +%CPU

(6) Check User Accounts and Groups
- See all user accounts (Hint: Malicious accounts can be found under bin/bash folder and )cat /etc/passwd
- See the last 10 groupstail -n 10 /etc/group
- See the last 10 groups
tail -n 10 /etc/group

- See the privileged user accounts under groups (Who is admin? and sudo?)grep -E <USERNAME> /etc/group
- See the privileged user accounts under groups (Who is admin? and sudo?)
grep -E <USERNAME> /etc/group

(7) Search Strings
- - Search a whole directory and subdirectory for strings:
sudo grep -Ril <STRING>

(8) Check File Directory
- Run ls -lha to see file directory including the hidden files with human-readable file size
ls -lha --sort=size

- Find out where the history file of the logged on user is located in:
ls -lha --sort=size

- Check the creation date of a file using stat or debugfs
stat filename
(note that if "birthdate" returns as "-", the creation time was not recorded)
lsblk
(to see the block device)
sudo debugfs -R 'stat <INODE NUMBER> DEVICE
or
sudo debugfs -R 'stat <FILEPATH> DEVICE


(9) Check Logs
- Use the Last or Last -F on the terminal to see display the list of all the users logged in and out since the file /var/log/wtmp was created. One or more usernames can be given as an argument to display their login in (and out) time and their host-name.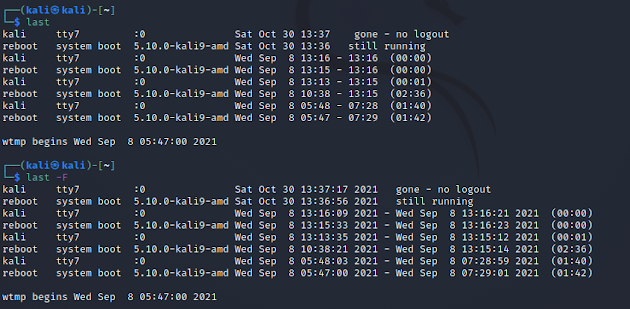
- Look at auth.log to check failure authentications or suspicious activities (you can focus on detection time)sudo cat /var/log/auth.log | grep "Oct 30 19:3" 
- LINUX DFIR RECOMMENDATIONS:-- Check user /etc/passwd and group accounts /etc/group-- Check shells and history logs-- Search added/modified files-- Check running processes, locations, and configs-- Export and analyze timelines comparing normal and abnormal activities

by dfirist@gmail.com
Comments
Post a Comment